
The Dow Jumped 1,569 Points, Then Gave It Back: What the Midterms Mean for Your Money
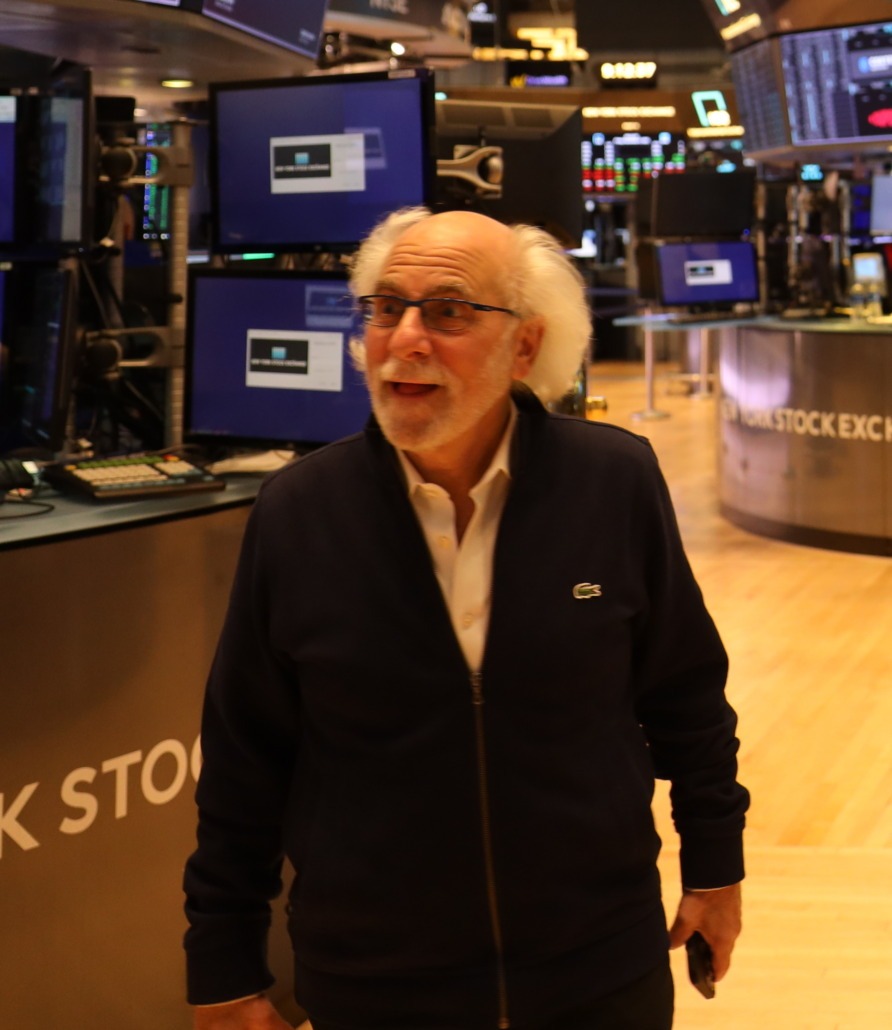
Photo: Bear Bull Traders / Wikimedia Commons (CC BY 2.0)
Democrats won the House and the Senate in the November 3 midterm elections, and Wall Street’s first reaction was a party. The Dow jumped 1,569 points the next day. Then, one day later, it gave the gain back. On Earn Your Leisure’s Market Mondays, Peter Tuchman, the NYSE floor trader known as the Einstein of Wall Street, told hosts Rashad Bilal and Troy Millings, with Ian Dunlap alongside, that history says the market usually rises after midterms when power splits in Washington. We checked his numbers against the record. Most of them hold up. One does not, and the week itself added a twist he did not predict.
WHAT ACTUALLY HAPPENED ON ELECTION NIGHT
Democrats took both chambers. In the Senate, they flipped Republican-held seats in Iowa, Kansas, Maine, North Carolina, Ohio, South Carolina and Texas, and picked up Mississippi when that race was called on November 11. That puts Democrats at no fewer than 54 seats, counting two independents who caucus with them, to 44 for Republicans, with Alaska still uncalled ahead of a November 18 ranked-choice tabulation. In the House, the Associated Press called control for Democrats, who have won at least 254 seats in races called so far, their biggest House majority in more than 20 years.
President Trump, a Republican, stays in the White House, and he keeps the veto pen. So the country gets divided government when the new Congress convenes on January 3, 2027: a Republican president, a Democratic Congress, and two years in which neither side can pass much without the other. Exit polls put the cost of living at the top of voters’ concerns, which is the part of this story that touches regular money the most.
THE FIRST REACTION, AND THE SECOND ONE
Wednesday, November 4 was the relief rally. The Dow Jones Industrial Average rose 1,569.40 points, about 3 percent, to 53,356.12, its biggest post-midterm one-day gain since 1982. The S&P 500 rose 119.70 points, about 1.6 percent, to 7,688.62, its best day in three months. The Nasdaq Composite gained 1.44 percent. Oil fell more than 8 percent, and gold rose.
Thursday, November 5 took it back. The S&P 500 fell 4.4 percent, its worst day since the tariff shock of April 2025. The Dow dropped 1,833 points. The Nasdaq fell 5.5 percent and closed in correction territory, more than 10 percent below its October 6 record close. The selling centered on AI and chip stocks. Nvidia fell almost 9 percent in the session, and analysts pointed to fears that a Democratic Congress could slow the data center buildout behind the AI boom, plus fresh doubts about how the buildout gets financed. Friday brought a partial bounce on a stronger than expected jobs report, and the S&P 500 still finished the week down 2.7 percent.
That two-day swing is the real lesson of the week. Day one was emotion and relief that the result was clear. Day two was the market repricing what the result could mean for specific industries. Neither day, on its own, was the whole story.
TUCHMAN’S READ, CHECKED
Here is the conversation that started this post:
Tuchman’s explanation for the Wednesday rally was short covering. Traders, he said, went into the election betting against the market, and when the Democratic win landed, they had to buy back in a hurry, which is what sent the Dow up roughly 1,500 points. That is his read as a floor trader, and it is worth hearing in his voice. The explanation most strategists gave on the record was a close cousin of it: relief. JPMorgan’s David Kelly said the results remove uncertainty from the market. Deutsche Bank’s George Saravelos argued divided government can restrain extreme policy outcomes and lower the risk premium investors demand. Allianz Trade’s Dan North made the classic version of the point: markets tend to like split control, because big changes in either direction get harder to pass.
His headline numbers need two corrections, one in his favor and one not:
- The Dow figure checks out. He said roughly 1,500 points. The actual gain was 1,569.40.
- The S&P figure does not. He put the S&P gain at about 250 points. The index actually rose 119.70 points. His number was roughly double the real one.
- His history stat was too modest. He said the market has risen nine times out of ten after midterms. On the standard measure, the 12 months after the vote, the record is perfect, as the next section shows.
WHAT HISTORY ACTUALLY SAYS
The post-midterm record is one of the most consistent patterns in market data, and it is stronger than Tuchman described it:
- The S&P 500 has finished higher 12 months after every one of the last 19 midterm elections, going back to 1950. Nineteen for nineteen. The average gain is 15.1 percent, with a median of 14.5 percent (Carson Group’s Ryan Detrick; Opening Bell Daily; the same 15.1 percent average comes out of Bloomberg data in a study by Stan Wong published by BNN Bloomberg).
- Measured from the end of October in midterm years, the average 12-month gain is 16.6 percent (BNY Investment Strategy and Research Group).
- Stretch the window back to 1946 and the streak is 20 for 20, with an average gain of 14.4 percent (Truist, Keith Lerner).
- The closest match to 2026 is the subset where one party lost both chambers of Congress, the way Republicans just did. Detrick found the S&P 500 rose in the year after every one of those flips, averaging 21.3 percent.
- The six months from November through April after a midterm have historically been the strongest stretch of the four-year presidential cycle, averaging about 14 percent (Carson Group).
Tuchman put the split-government gain at about 18 percent. That sits inside the range the strategists publish for post-flip years, between the 15.1 percent all-midterm average and Detrick’s 21.3 percent for both-chamber flips. Call that one close enough, with the honest caveat that long-run data cuts the other way too: measured across whole calendar years from 1926 to 2023, a Republican president working with a divided Congress averaged 7.33 percent a year, about half the return under unified control (Retirement Researcher data). The strong numbers are specifically about the window right after a midterm, not about split government in general.
Three more caveats belong on the record. Nineteen elections is a small sample. Most of these figures are price returns and leave out dividends. And midterm years tend to be rough before they are rewarding: the average peak-to-trough drop inside a midterm year is about 17.5 percent, the deepest of any year in the cycle. The pattern rewards people who sat through the rough part. It does not promise the ride is smooth.
GRIDLOCK, IN PLAIN ENGLISH
Tuchman ended his segment with the blunt version: a president from one party and a Senate from the other creates a complete roadblock where nothing gets done. For investors, that roadblock is usually the point. Here is what it means in practice for regular money:
- Big tax changes become unlikely in either direction. Neither party can rewrite the tax code alone, and the president’s veto guards the rest.
- The big laws already on the books stay on the books. Repeals need both chambers and a signature.
- Policy risk drops, which is part of why risk premiums fall and stocks often breathe easier.
- Sector risk does not drop. Congress cannot pass a law on its own, but hearings, investigations and state-level fights can still move whole industries, exactly the way data center politics hit chip stocks on November 5.
Gridlock also blocks the things voters said they wanted. A Congress that cannot pass much cannot pass cost-of-living relief either. The roadblock cuts both ways, and honest analysis has to say so.
WHERE THE MARKET STANDS TONIGHT
One more Tuchman claim deserves a check, because it is the one that matters most for anyone looking at a 401(k) balance tonight. He said the S&P 500 was trading within about 2 percent of its record highs despite tariffs, two wars and everything since COVID. The spirit of that is right, and the number is a touch rosy. The index set its all-time closing high at 7,818.93 on October 6. It closed Wednesday, November 11 at 7,619.38, which is 2.6 percent below the record, and it closed Friday, November 13 at 7,561.67, about 3.3 percent below. After a tariff regime, the Iran war driving oil, a post-COVID inflation fight and a rate shock, the market is sitting within a few points of the highest level it has ever closed at, and it is still up about 11 percent for the year. Resilience is a fair word for that.
WHAT IT MEANS FOR REGULAR MONEY
Plain takeaways, in plain language:
- The historical pattern is about the 12 months after a midterm, not the 12 days. Anyone who traded the Wednesday rally as a sure thing got Thursday as an answer.
- The pattern’s real lesson is not “buy the election.” It is that midterm-year fear has historically been a bad reason to sell. The streak was built by people who held through the drawdowns that midterm years reliably produce.
- Divided government lowers the odds of a policy surprise hitting your whole portfolio at once. It does not protect any single industry, as AI stocks just demonstrated.
- Averages are not promises. Nineteen for nineteen is a streak, and streaks end. The 2026 version comes with its own complications, including an AI spending boom whose financing is now a live political fight.
- The boring moves still run the show: steady contributions, diversification, and not letting one wild week rewrite a long plan.
Earn Your Leisure built its audience by putting working market voices in front of regular investors, and this segment is a good example of why that matters. Tuchman gave his audience the right big idea, and the data backs the idea more strongly than he stated it. The details are where a careful investor earns their keep.
Educational Disclaimer
Educational Disclaimer: Content about investing, credit, retirement, annuities, and personal finance on The Green Social is for general education and information only. It is not financial, investment, tax, or legal advice, and it is not a recommendation to buy, sell, or hold any product or security. Everyone’s situation is different; speak with a licensed financial, tax, or legal professional about your own circumstances before making a decision.
Editorial & Reporting Disclaimer
The Green Social is an independent media and commentary publication, not a wire service or a court of record. News and media posts are based on publicly available information and reporting by the sources named in the post at the time of publication. Facts that could not be independently verified are identified as reported or unverified, or are omitted. Quotations are attributed to their stated sources; a quotation’s inclusion means it was reported, not that The Green Social endorses it.
Analysis and opinion in this post are the author’s own and are labelled as such; they are not statements of fact. Events, statements, and coverage may develop after publication. Material updates and corrections will be noted on this post.
If you are a person or organisation discussed in this post and believe any statement is inaccurate or incomplete, or you wish to provide a response for publication, contact us through the Contact page on thegreensocial.com. Verified corrections and substantive responses are added promptly. Nothing in this post is legal, financial, or professional advice.
Photos and video of the public figures featured in this post are credited to the sources named with each image. The Green Social does not claim ownership of third-party media, which remains the property of its respective owners.
#Midterms2026 #StockMarket #401k



Leave a Reply
Want to join the discussion?Feel free to contribute!